


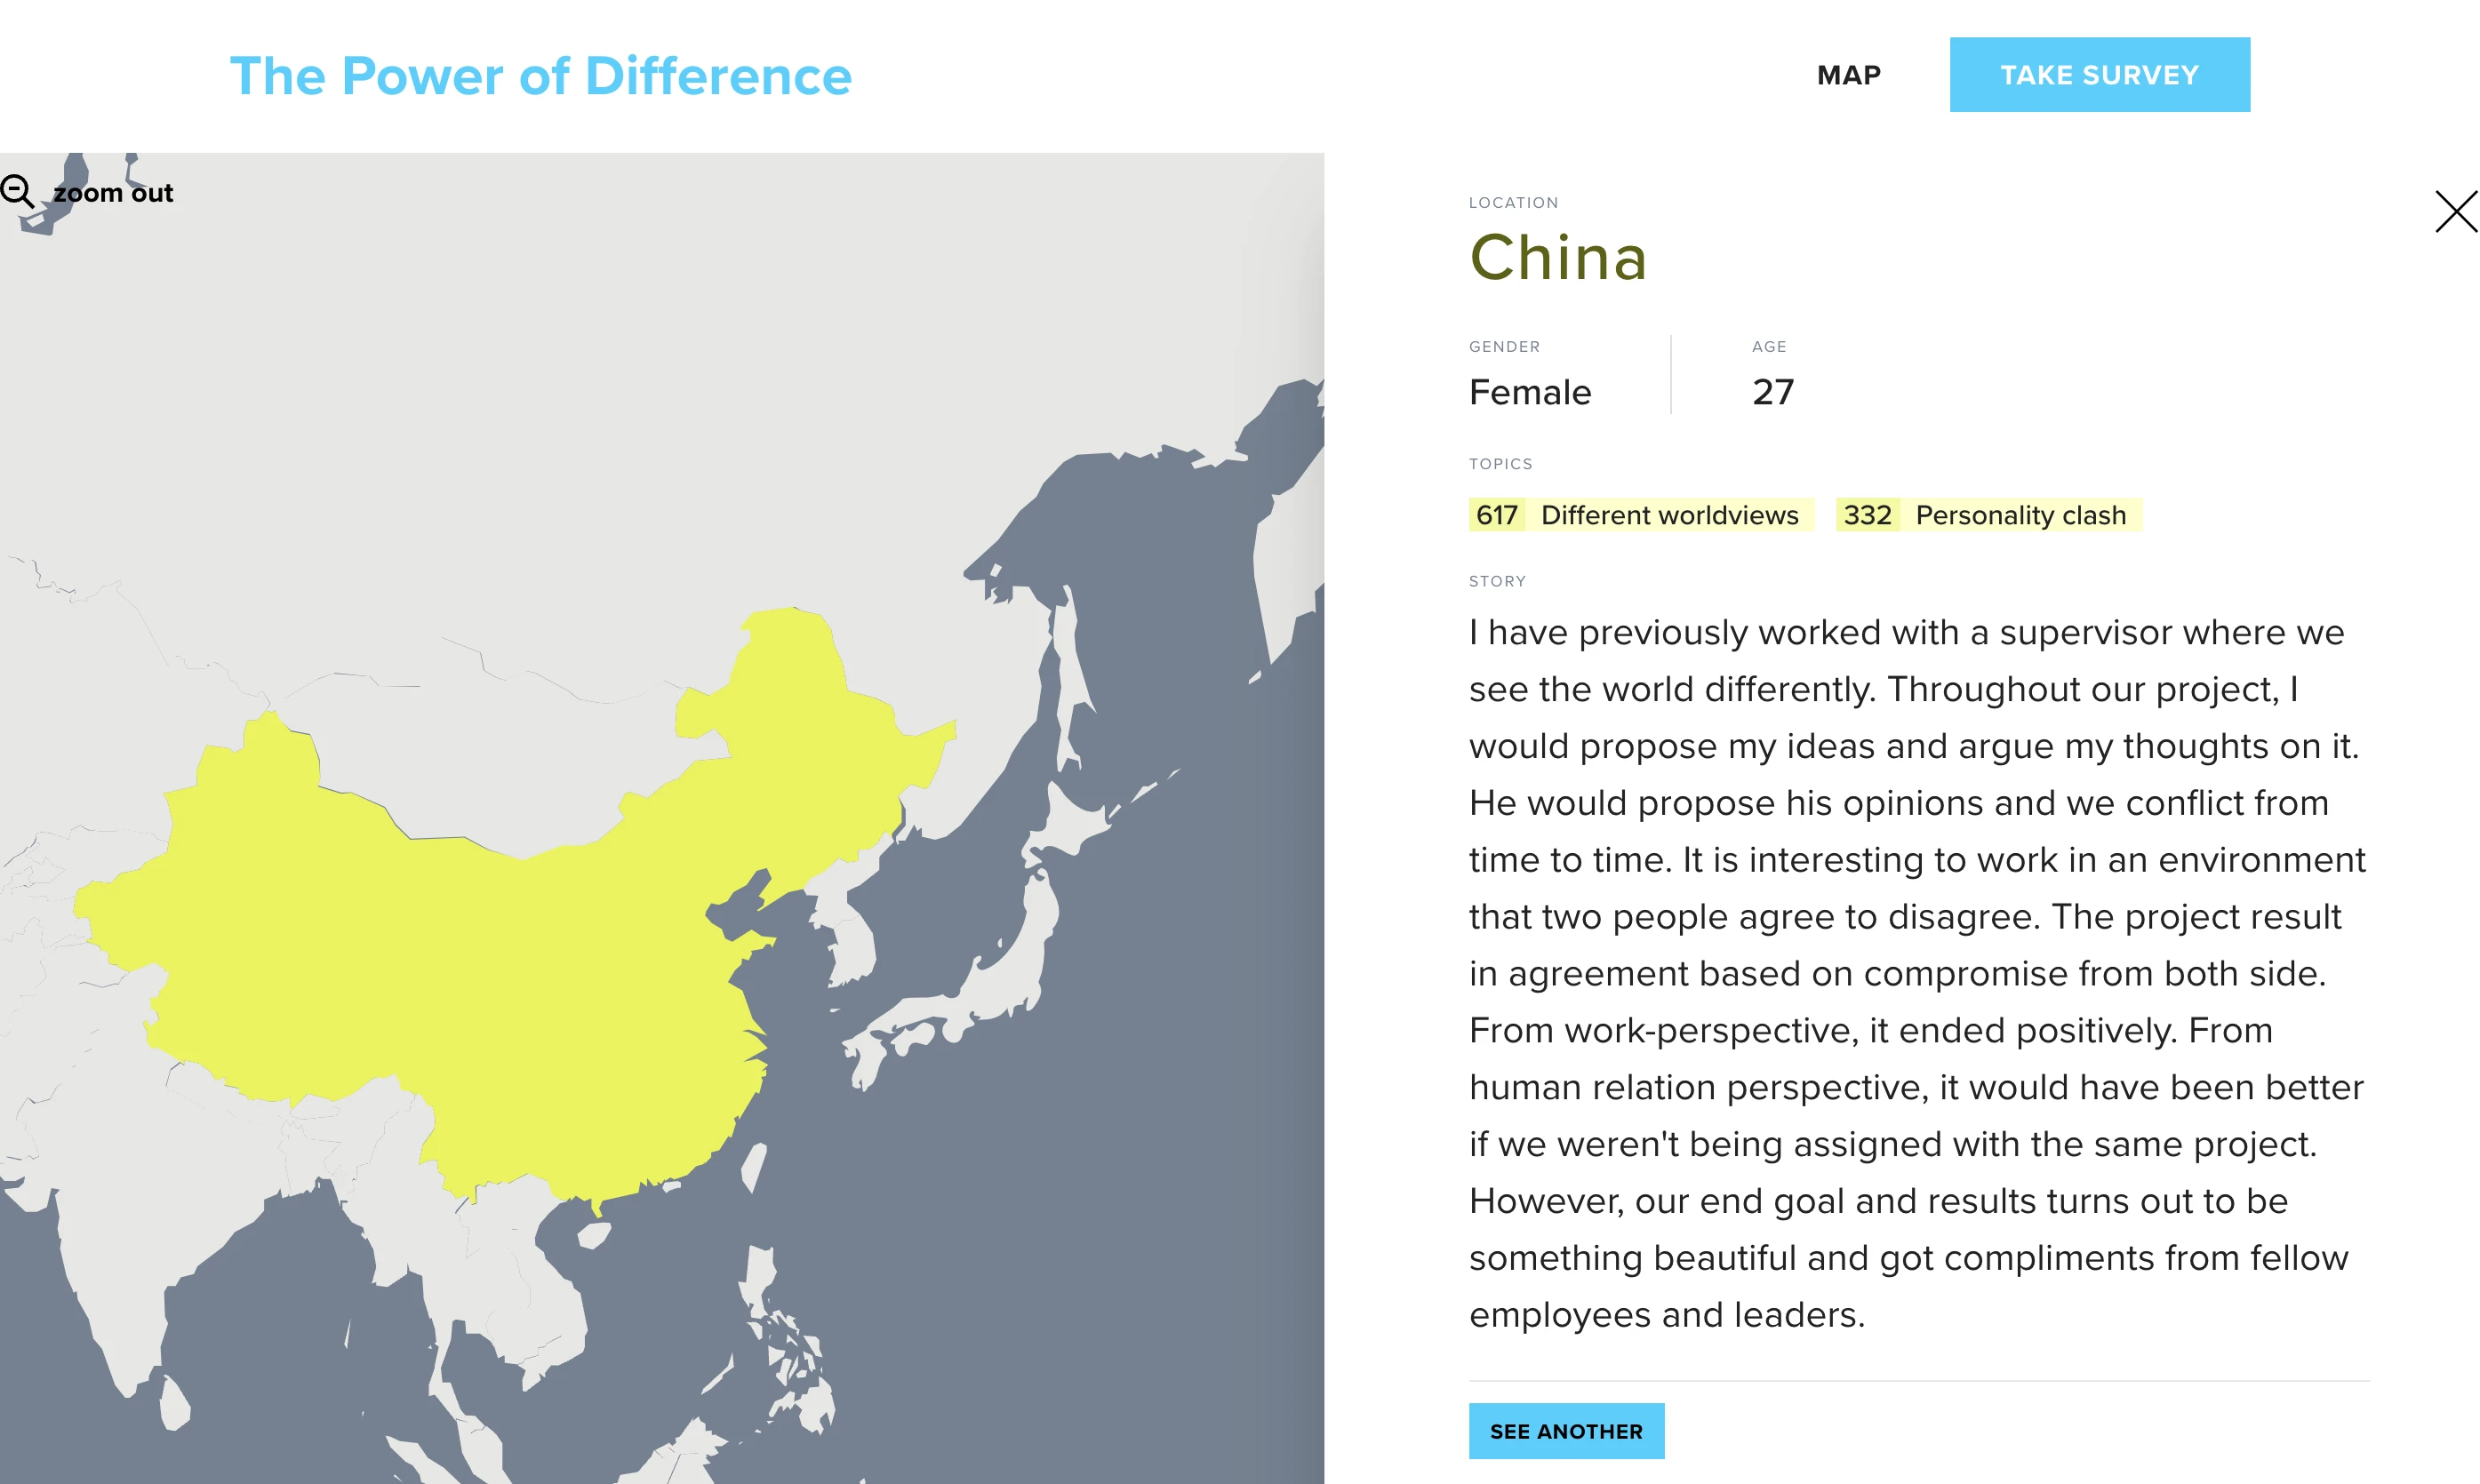
In 2020, I built an interactive map for the author Dan Pink. He was conducting a survey for a book he was writing, that collected peoples regrets. He wanted to show in a fun and visual way the entries he had collected along the way. Using the qualtrics api, and serverless functions I pulled down results, and stored them in a json file. The next step was displaying the results. I built him a World map who’s countries, were colored based on how many regrets had been collected for that location, and could be clicked, and then zoom in on the country and display a few regrets for that location. I used svg for the map so that I could animate the viewbox when the user clicked to get a nice transition from seeing the whole world to the country. The finish version is at wordregretsurvey.com.
Then in 2022, I was approached by a different author, and she wanted to have a similar experience for displaying her study. This allowed me to iterate and improve on an already successful project. This time I added routing, improved performance and revamped the style of the map.
WHAT I LEARNED
I learned how to implement complex deployments CI/CD github actions, serverless functions, and got really good at transforming data. I learned how svg viewboxes work and how to measure shapes inside svg to be able to create the zoom animation.
TECH:
- React
- Gatsby
- Wordpress
- serverless Functions
- Github actions
- SVG
- react spring